Use the Home page
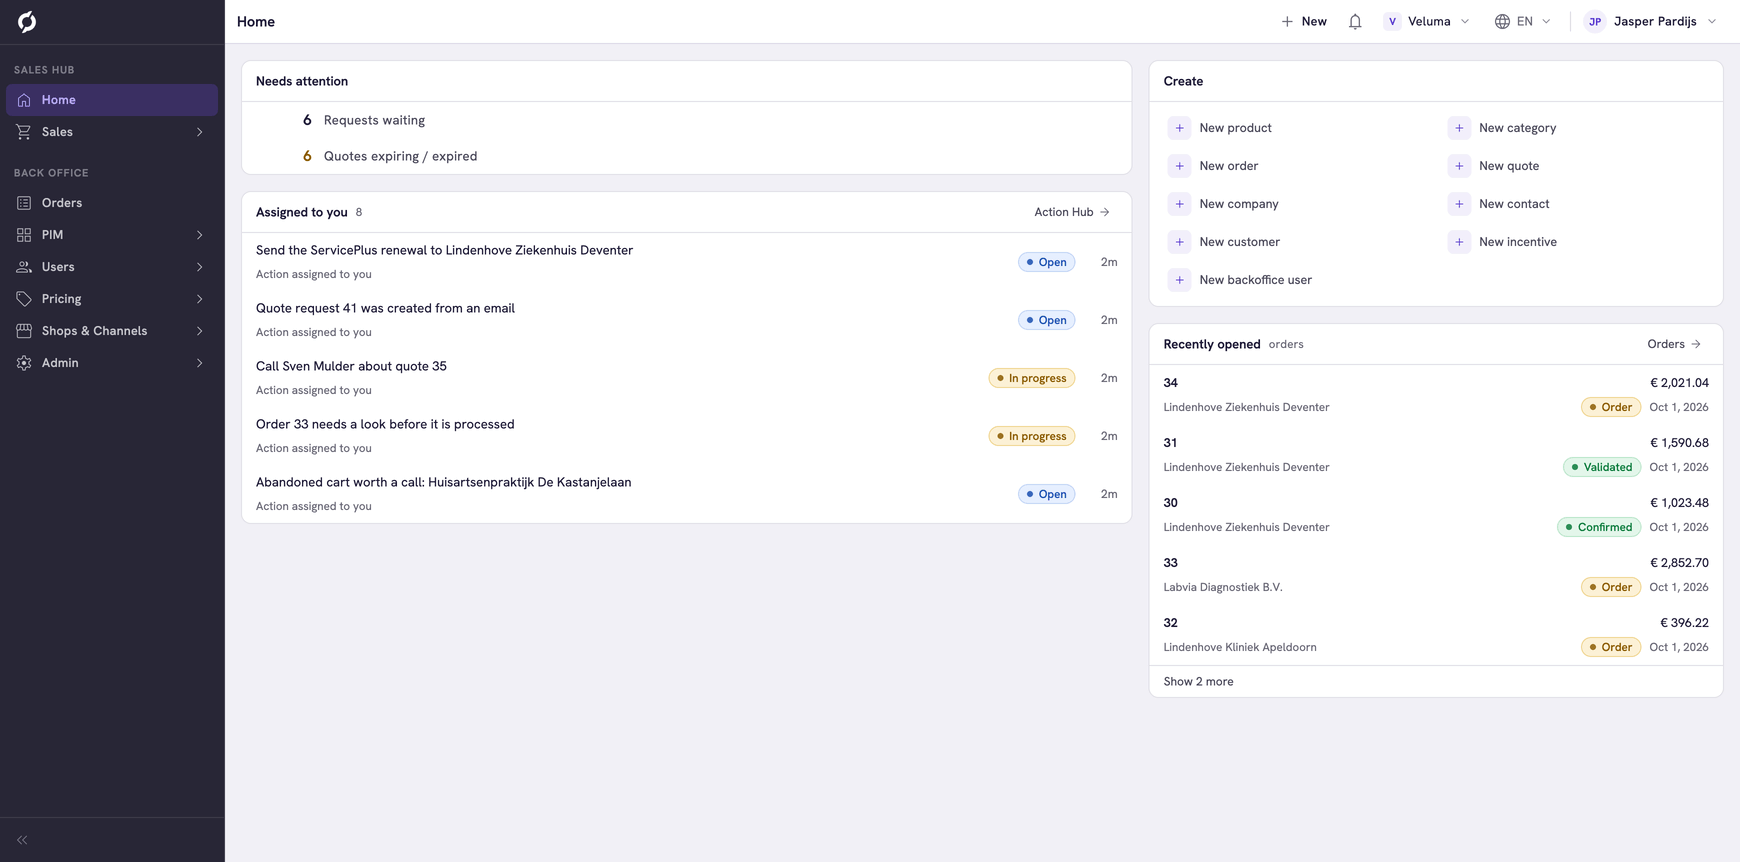
The Home page is the first page you see after you sign in. It shows what is waiting for you: work that needs attention, the actions assigned to you, shortcuts to create something and the orders you opened last.
See what needs attention
Needs attention counts work in your environment that is waiting for someone. Click a number to open the list behind it, filtered to exactly those items.
| Row | What it counts | What to do in the list |
|---|---|---|
| Requests waiting | Quote requests that nobody answered yet | Open a request and turn it into a quote or an order. See Requests |
| Export failures | Orders that could not be passed on to another system, for example your ERP | Add the Export message column with the Table editor to read what went wrong |
| Quotes expiring / expired | Quotes that expire within 7 days or have expired | Call the customer or set a new Valid until date |
| Products in no category | Products that are in no category | Tick the products and click Move to category. See Products |
A row only shows when there is something to count. When everything is clear, the section says "Nothing needs attention right now."
The counts follow Only mine. If you switched it on in a list, the Home page counts only the companies you picked under My companies. See Work with lists.
Pick up your actions
Assigned to you shows up to five actions from the Action Hub that are assigned to you and are open or in progress. The total stands next to the title. Each row shows the action, its status and how old it is.
Click Action Hub to see all of them and to work on one. See Action Hub.
The list stays empty when no workflow in your environment creates actions.
Create something
Create has the same shortcuts as New in the top bar, for example for an order, a quote or a company. You only see the ones your roles allow.
Go back to an order
Recently opened lists the orders you opened last, each with its number, total, status and date. Click one to open it again.
The list shows five orders. Click Show N more for the rest, up to ten. It is kept per environment with your account, so it stays after you sign out and on another computer. Click Orders for the full list.
Related pages
- Work with lists - the next step for a new user
- Action Hub
- I want to… - find the page for a task